Hey there! If you’re diving into the world of data analytics, you’re in for an exciting journey. Data analytics is all about transforming raw data into meaningful insights and mastering it can really boost your decision-making skills. Today, I want to walk you through some top techniques and tools in data analytics that can help you shine in master data analytics. So, let’s get started!

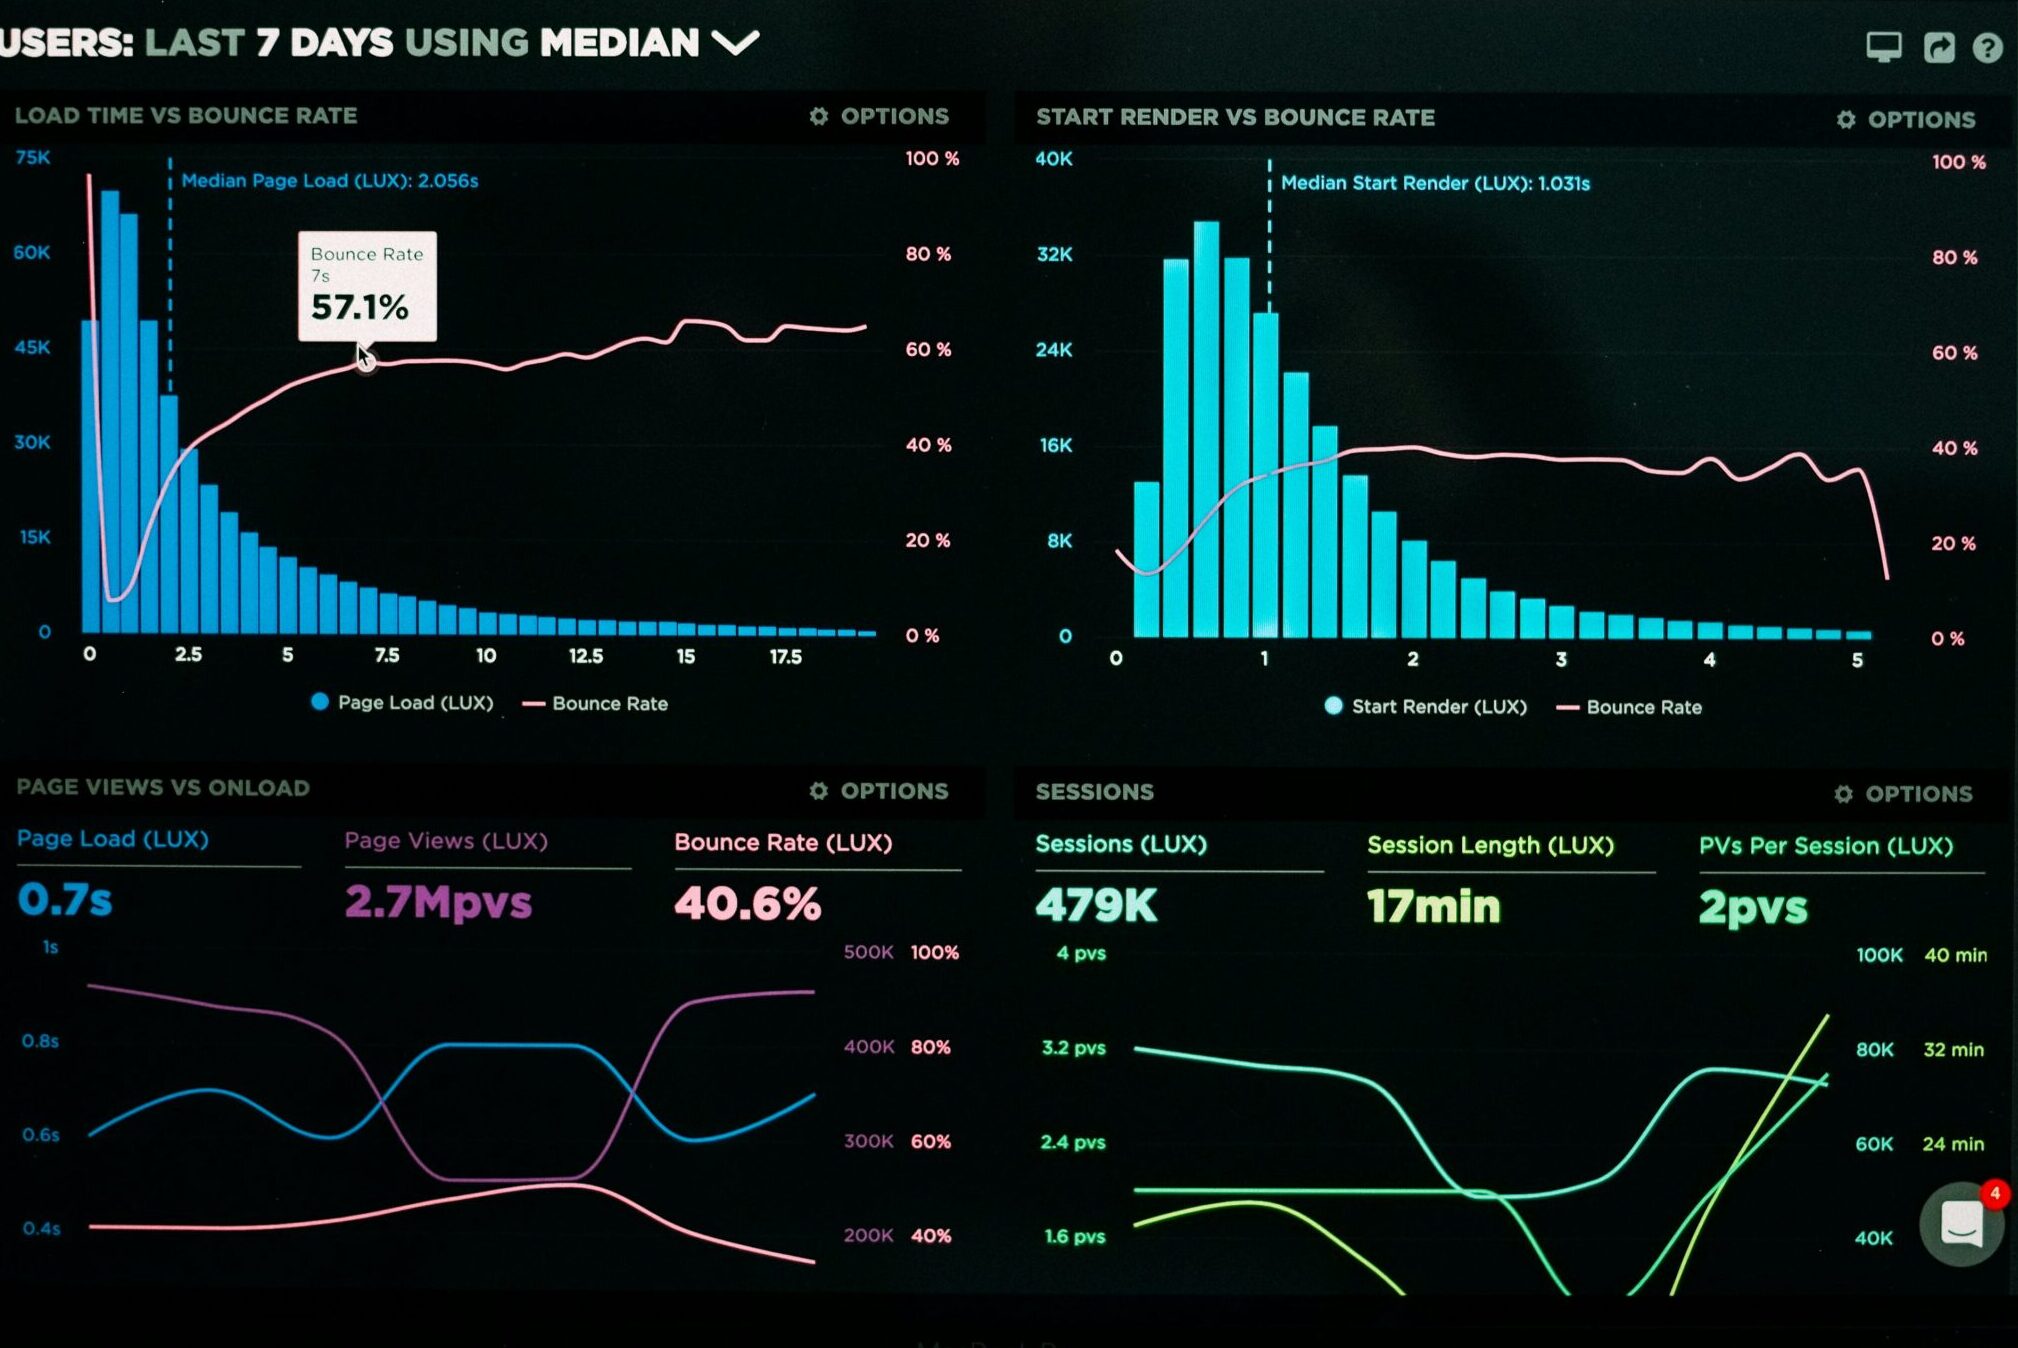
Figure 1: Data Analytics Visualization
Top Techniques to help master Data Analytics
1.) Descriptive Analytics: Think of this as the foundation. It helps you understand what has happened in the past. You can use:
- Data Aggregation: Summarizing data.
- Data Mining: Discovering patterns.
- Trend Analysis: Identifying trends over time.
2.) Diagnostic Analytics: Now we’re getting into the why. This technique digs deeper to find out why something happened. Tools you might use include:
- Drill-down Analysis: Breaking data down into finer details.
- Correlation Analysis: Finding relationships between variables.
- Root Cause Analysis: Identifying the cause of issues.
3.) Predictive Analytics: Here’s where it gets really cool. This technique helps you forecast future outcomes based on historical data. You’ll use:
- Regression Analysis: Understanding relationships between variables.
- Time Series Analysis: Analyzing data points collected over time.
- Predictive Modeling: Creating models to predict future events.
4.) Prescriptive Analytics: This is about recommending actions. It helps you figure out what steps to take to achieve a goal. Key methods are:
- Optimization Models: Finding the best solution.
- Decision Analysis: Evaluating different choices.
- Simulation Modeling: Testing scenarios to see possible outcomes.
Top Tools for you to master Data Analytics
Let’s talk about the tools that can make all this happen:
1.) Excel: The go-to tool for many. It’s great for basic data analysis and visualization.
- Pros: Easy to use, versatile.
- Cons: Not ideal for large datasets.
2.) SQL: Essential for managing databases.
- Pros: Powerful for querying databases.
- Cons: Requires knowledge of SQL syntax.
3.) R: Perfect for statistical computing and graphics.
- Pros: Extensive libraries for data analysis.
- Cons: Steeper learning curve.
4.) Python: A versatile programming language with powerful data analysis libraries.
- Pros: Easy to learn, highly versatile.
- Cons: Slower execution compared to compiled languages.
5.Tableau: Excellent for creating interactive dashboards.
- Pros: User-friendly, great visualization capabilities.
- Cons: Can be expensive.
6.) Power BI: Microsoft’s powerful business analytics tool.
- Pros: Integrates well with other Microsoft products.
- Cons: Limited free version.
Table 1: Comparison of Data Analytics Tools
| Tool | Pros | Cons |
|---|---|---|
| Excel | Easy to use, versatile | Not ideal for large datasets |
| SQL | Powerful for querying databases | Requires SQL syntax knowledge |
| R | Extensive libraries for data analysis | Steeper learning curve |
| Python | Easy to learn, versatile | Slower execution |
| Tableau | User-friendly, great visualization | Can be expensive |
| Power BI | Integrates with Microsoft products | Limited free version |

Figure 2: Data Analytics Tools
Implementing Data-Driven Decision Making to master data analytics
Now that we’ve covered the techniques and tools, let’s talk about how to actually implement data-driven decision-making:
- Define Objectives: Be clear about what you want to achieve.
- Collect Data: Gather data from various sources.
- Clean and Prepare Data: Make sure your data is clean and ready for analysis.
- Analyze Data: Use the appropriate techniques to get insights.
- Visualize Data: Present your data in a way that’s easy to understand.
- Make Decisions: Use the insights to inform your decisions.
Table 2: Steps to Implement Data-Driven Decision Making
| Step | Description |
|---|---|
| Define Objectives | Set clear goals for what you want to achieve |
| Collect Data | Gather data from various sources |
| Clean and Prepare Data | Ensure data quality through cleaning and preparation |
| Analyze Data | Apply analytical techniques to derive insights |
| Visualize Data | Use tools to present data visually |
| Make Decisions | Use insights for informed decision-making |
Conclusion
Mastering data analytics can open doors to incredible opportunities. By understanding and applying these top techniques and tools, you’ll be able to make data-driven decisions that can transform your career. Use this “Data Analytics Guide 2024” to navigate your journey and become a pro at turning data into actionable insights.
By following this guide, you’ll be well on your way to mastering data analytics and making impactful, data-driven decisions. Ready to get started in the world of tech? Let’s dive in together! learn the full course in w3school


